TOC
URL: https://beanteam.shinyapps.io/MrBean/
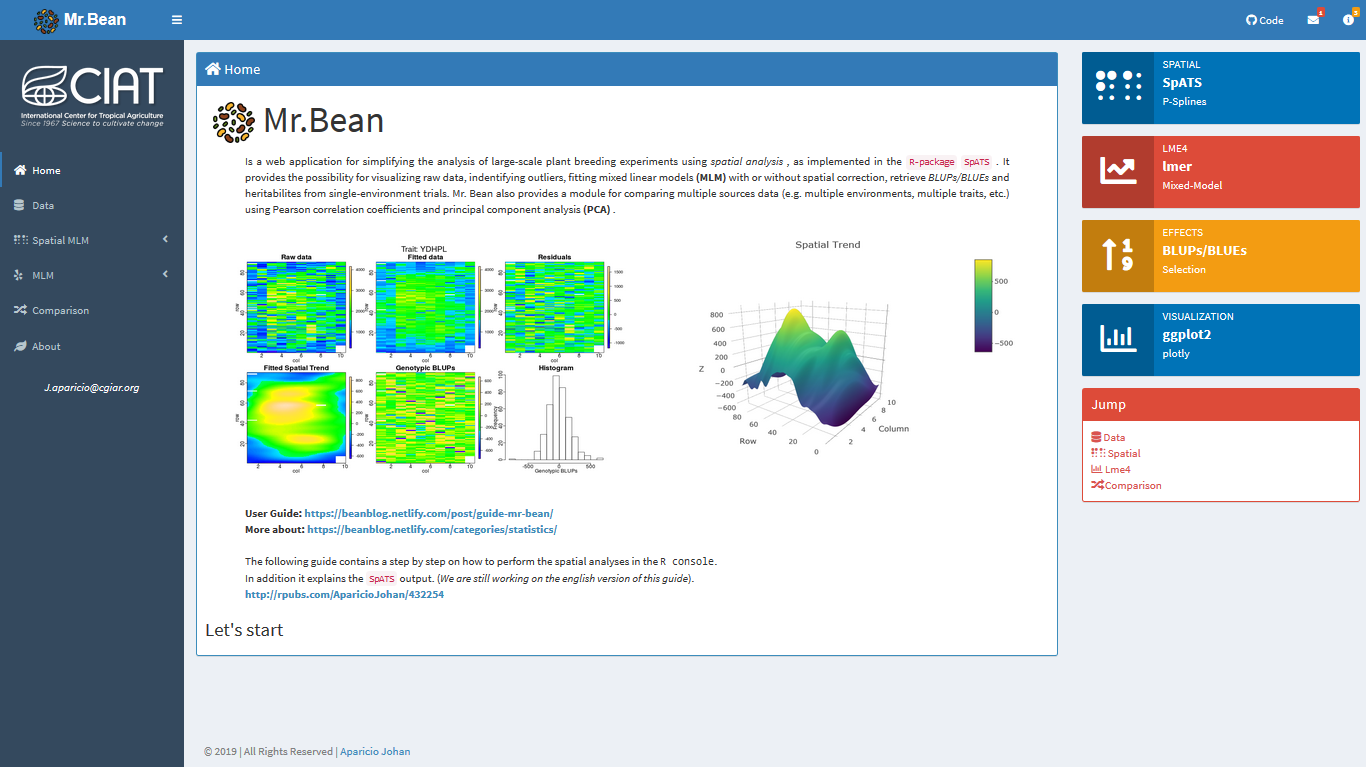
Mr.Bean
R-package SpATS . It provides the possibility for visualizing raw data, indentifying outliers, fitting mixed linear models (MLM) with or without spatial correction, retrieve BLUPs/BLUEs and heritabilites from single-environment trials. Mr. Bean also provides a module for comparing multiple sources data (e.g. multiple environments, multiple traits, etc.) using Pearson correlation coefficients and principal component analysis (PCA) . Tab navigation
1. Data
Use this module to load and visualize your raw data. Please follow the indications for tidying data. In short, there should be one observation per row, and each column should represent an independent feature or characteristic of that observation.
2. Spatial Model
2.1. SpATS
Use this sub-module to fit the MLM with spatial correction. Follow the step-by-step guide (red button). After fitting the model, you’ll be able to get a summary of the model’s components (effective dimensions, convergence, deviance, etc.), display and download the fitted spatial trend in your trial (2D or 3D), and visualize the variance components in the model. In addition you can directly download the BLUEs/BLUPs for your chosen response variable.
2.2. BLUPs/BLUEs
Use this sub-module to visualize the BLUEs/BLUPs from the previous fitted model. There's also a download button for your BLUEs/BLUPs.
2.3. Residuals
3. Mixed model
3.1. Lme4
Use this sub-module to fit the MLM for alpha-lattice, RCB designs, or write your own linear model using the Lme4 syntax.
3.2. BLUPs/BLUEs
Use this sub-module to visualize the BLUEs/BLUPs from the previous fitted model. There’s also a download button for your BLUEs/BLUPs.
4. Comparison
Use this module to make multiple comparisons from e.g. multiple environments, multiple traits, etc. Using Pearson correlation coeffiecients for paired comparisons and PCA for multiple comparisons. This module provides its own box for uploading your data.